Latest run results
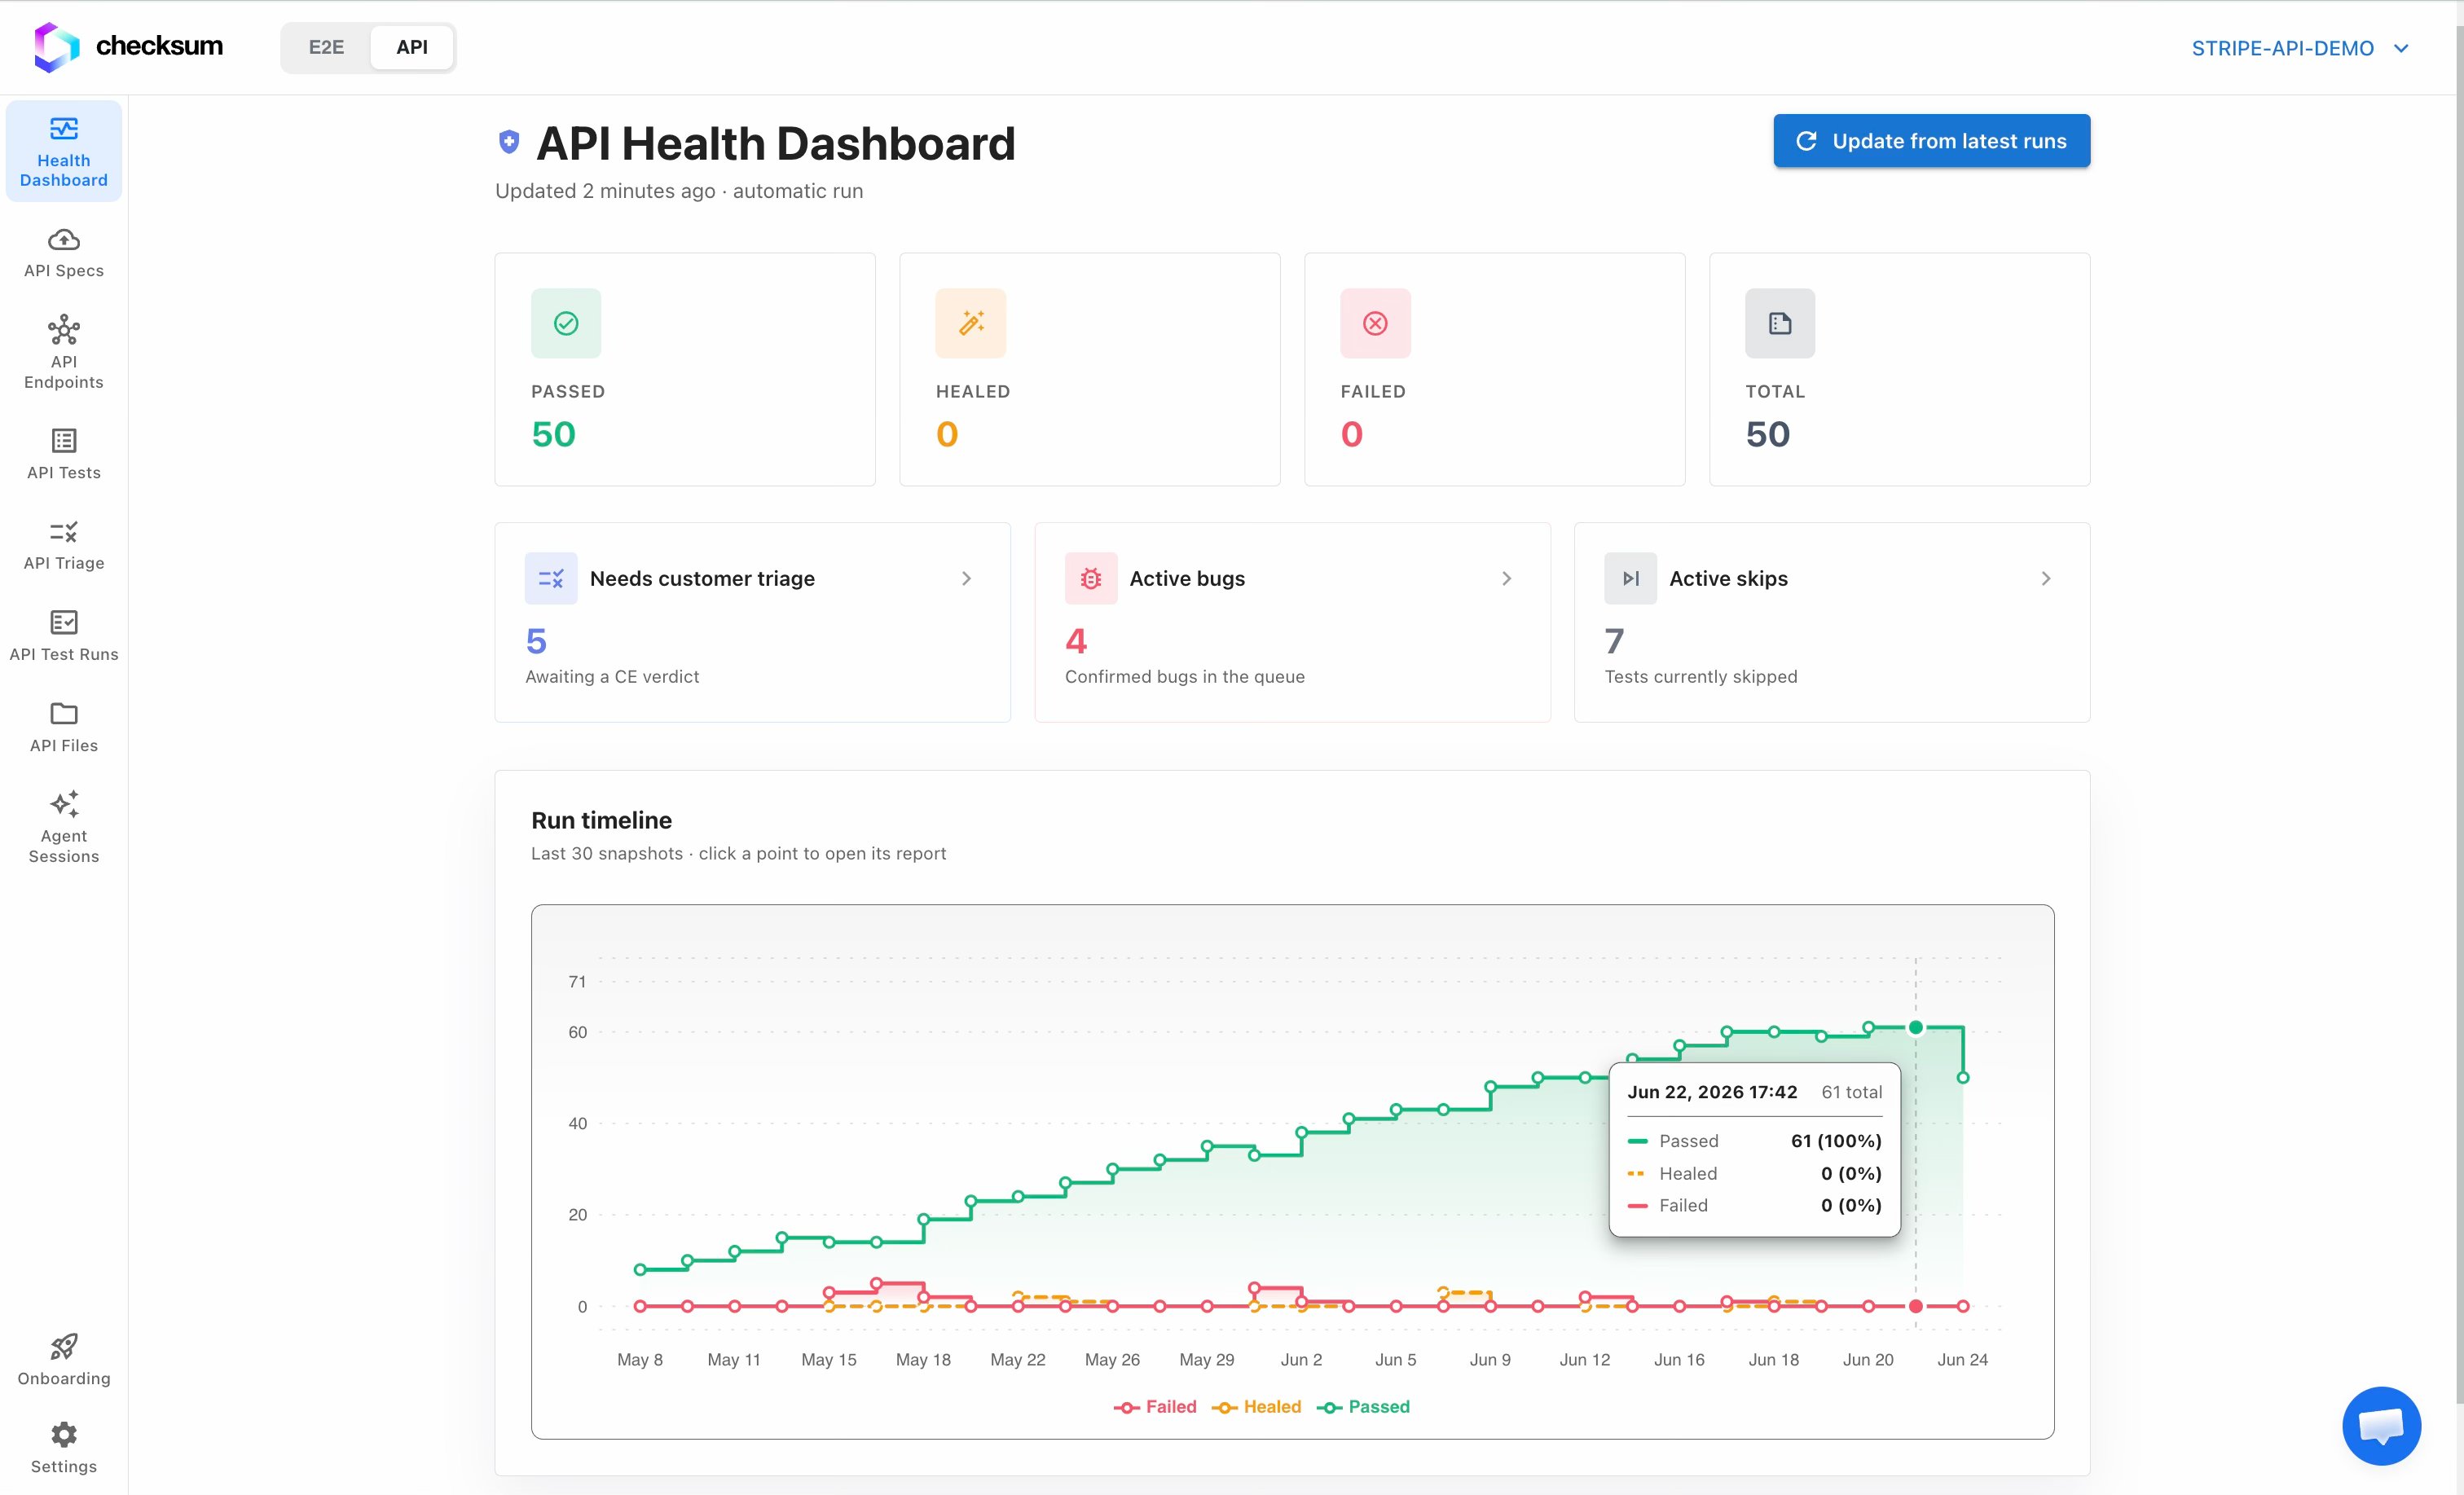
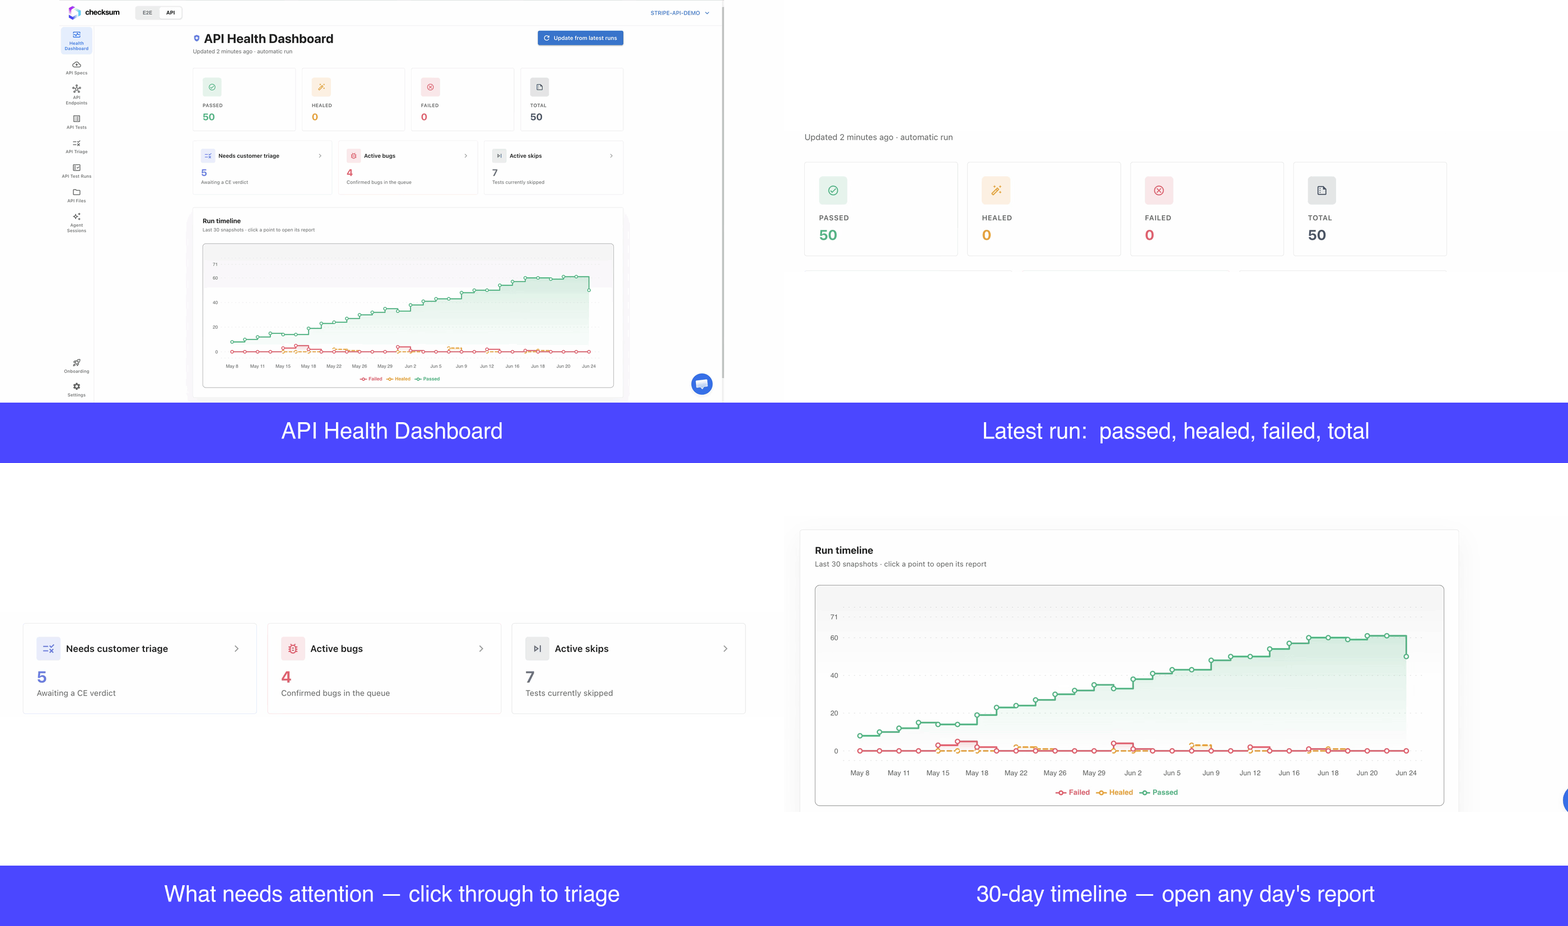
At the top, four tiles summarize your most recent run (Passed, Healed, Failed, and Total), the fastest way to confirm your API is healthy after a run. The header notes when it was last updated, and Update from latest runs refreshes the dashboard on demand.Outstanding work
Below the results, the dashboard surfaces what still needs attention, with each metric linking straight into triage:- Tests needing a verdict: failures awaiting your review. Click through to the API Triage board.
- Active bugs and active skips: open the triage board pre-filtered to those items.

30-day timeline
The timeline shows a snapshot of the last 30 days, one report per day. Click any day to open that day’s report and see how your suite looked over time.