Three numbers to know
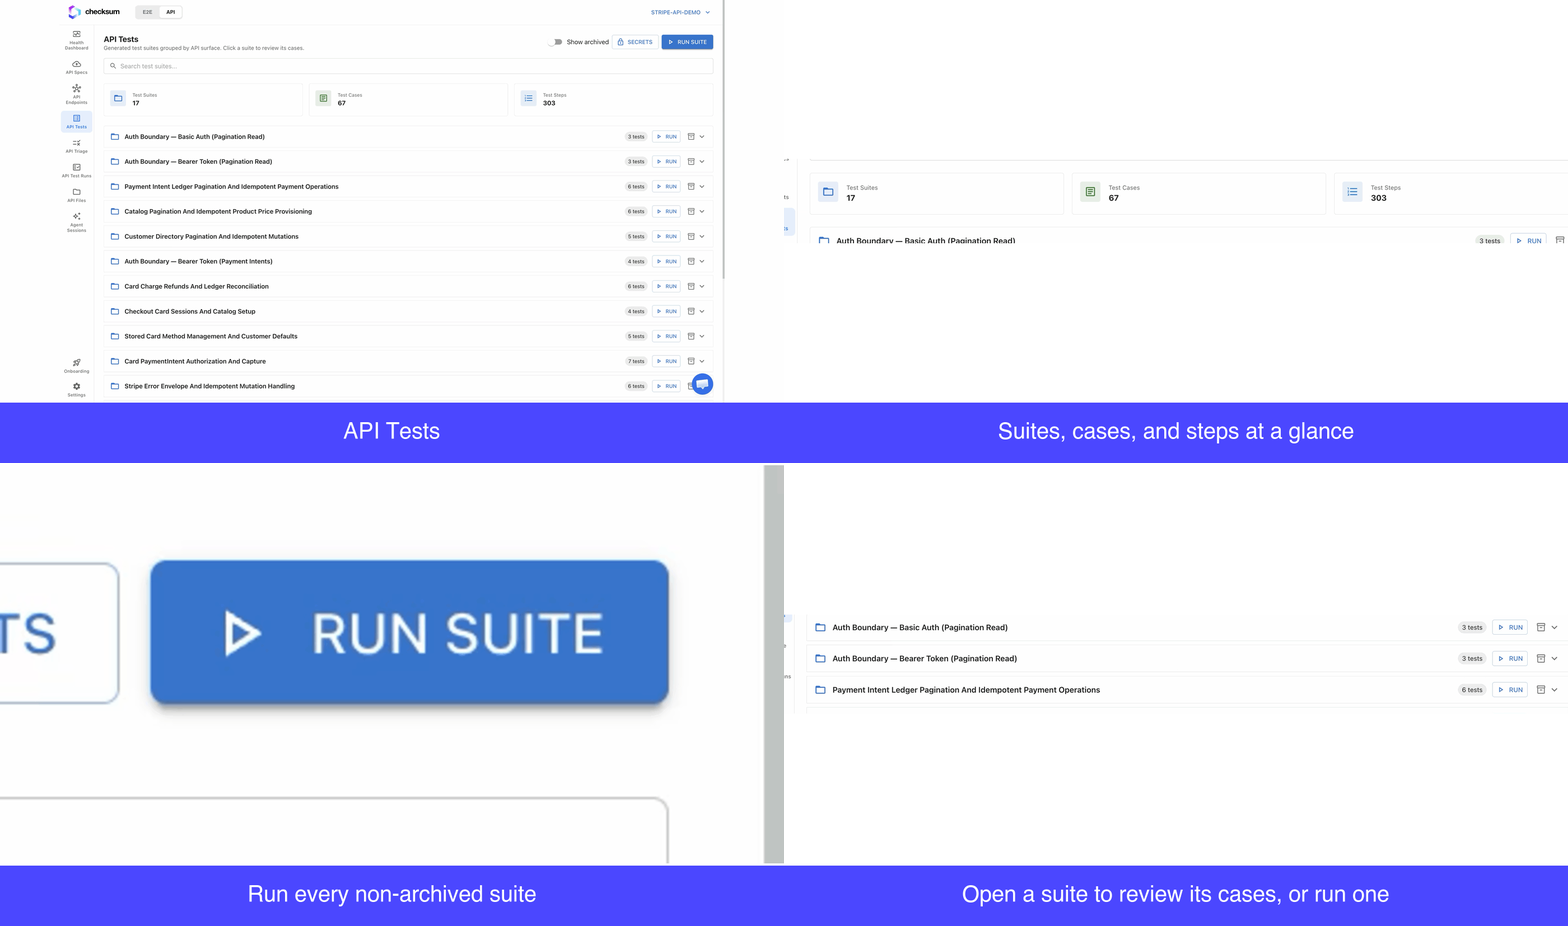
At the top of the page, three tiles summarize your suite:Suites, cases, and steps
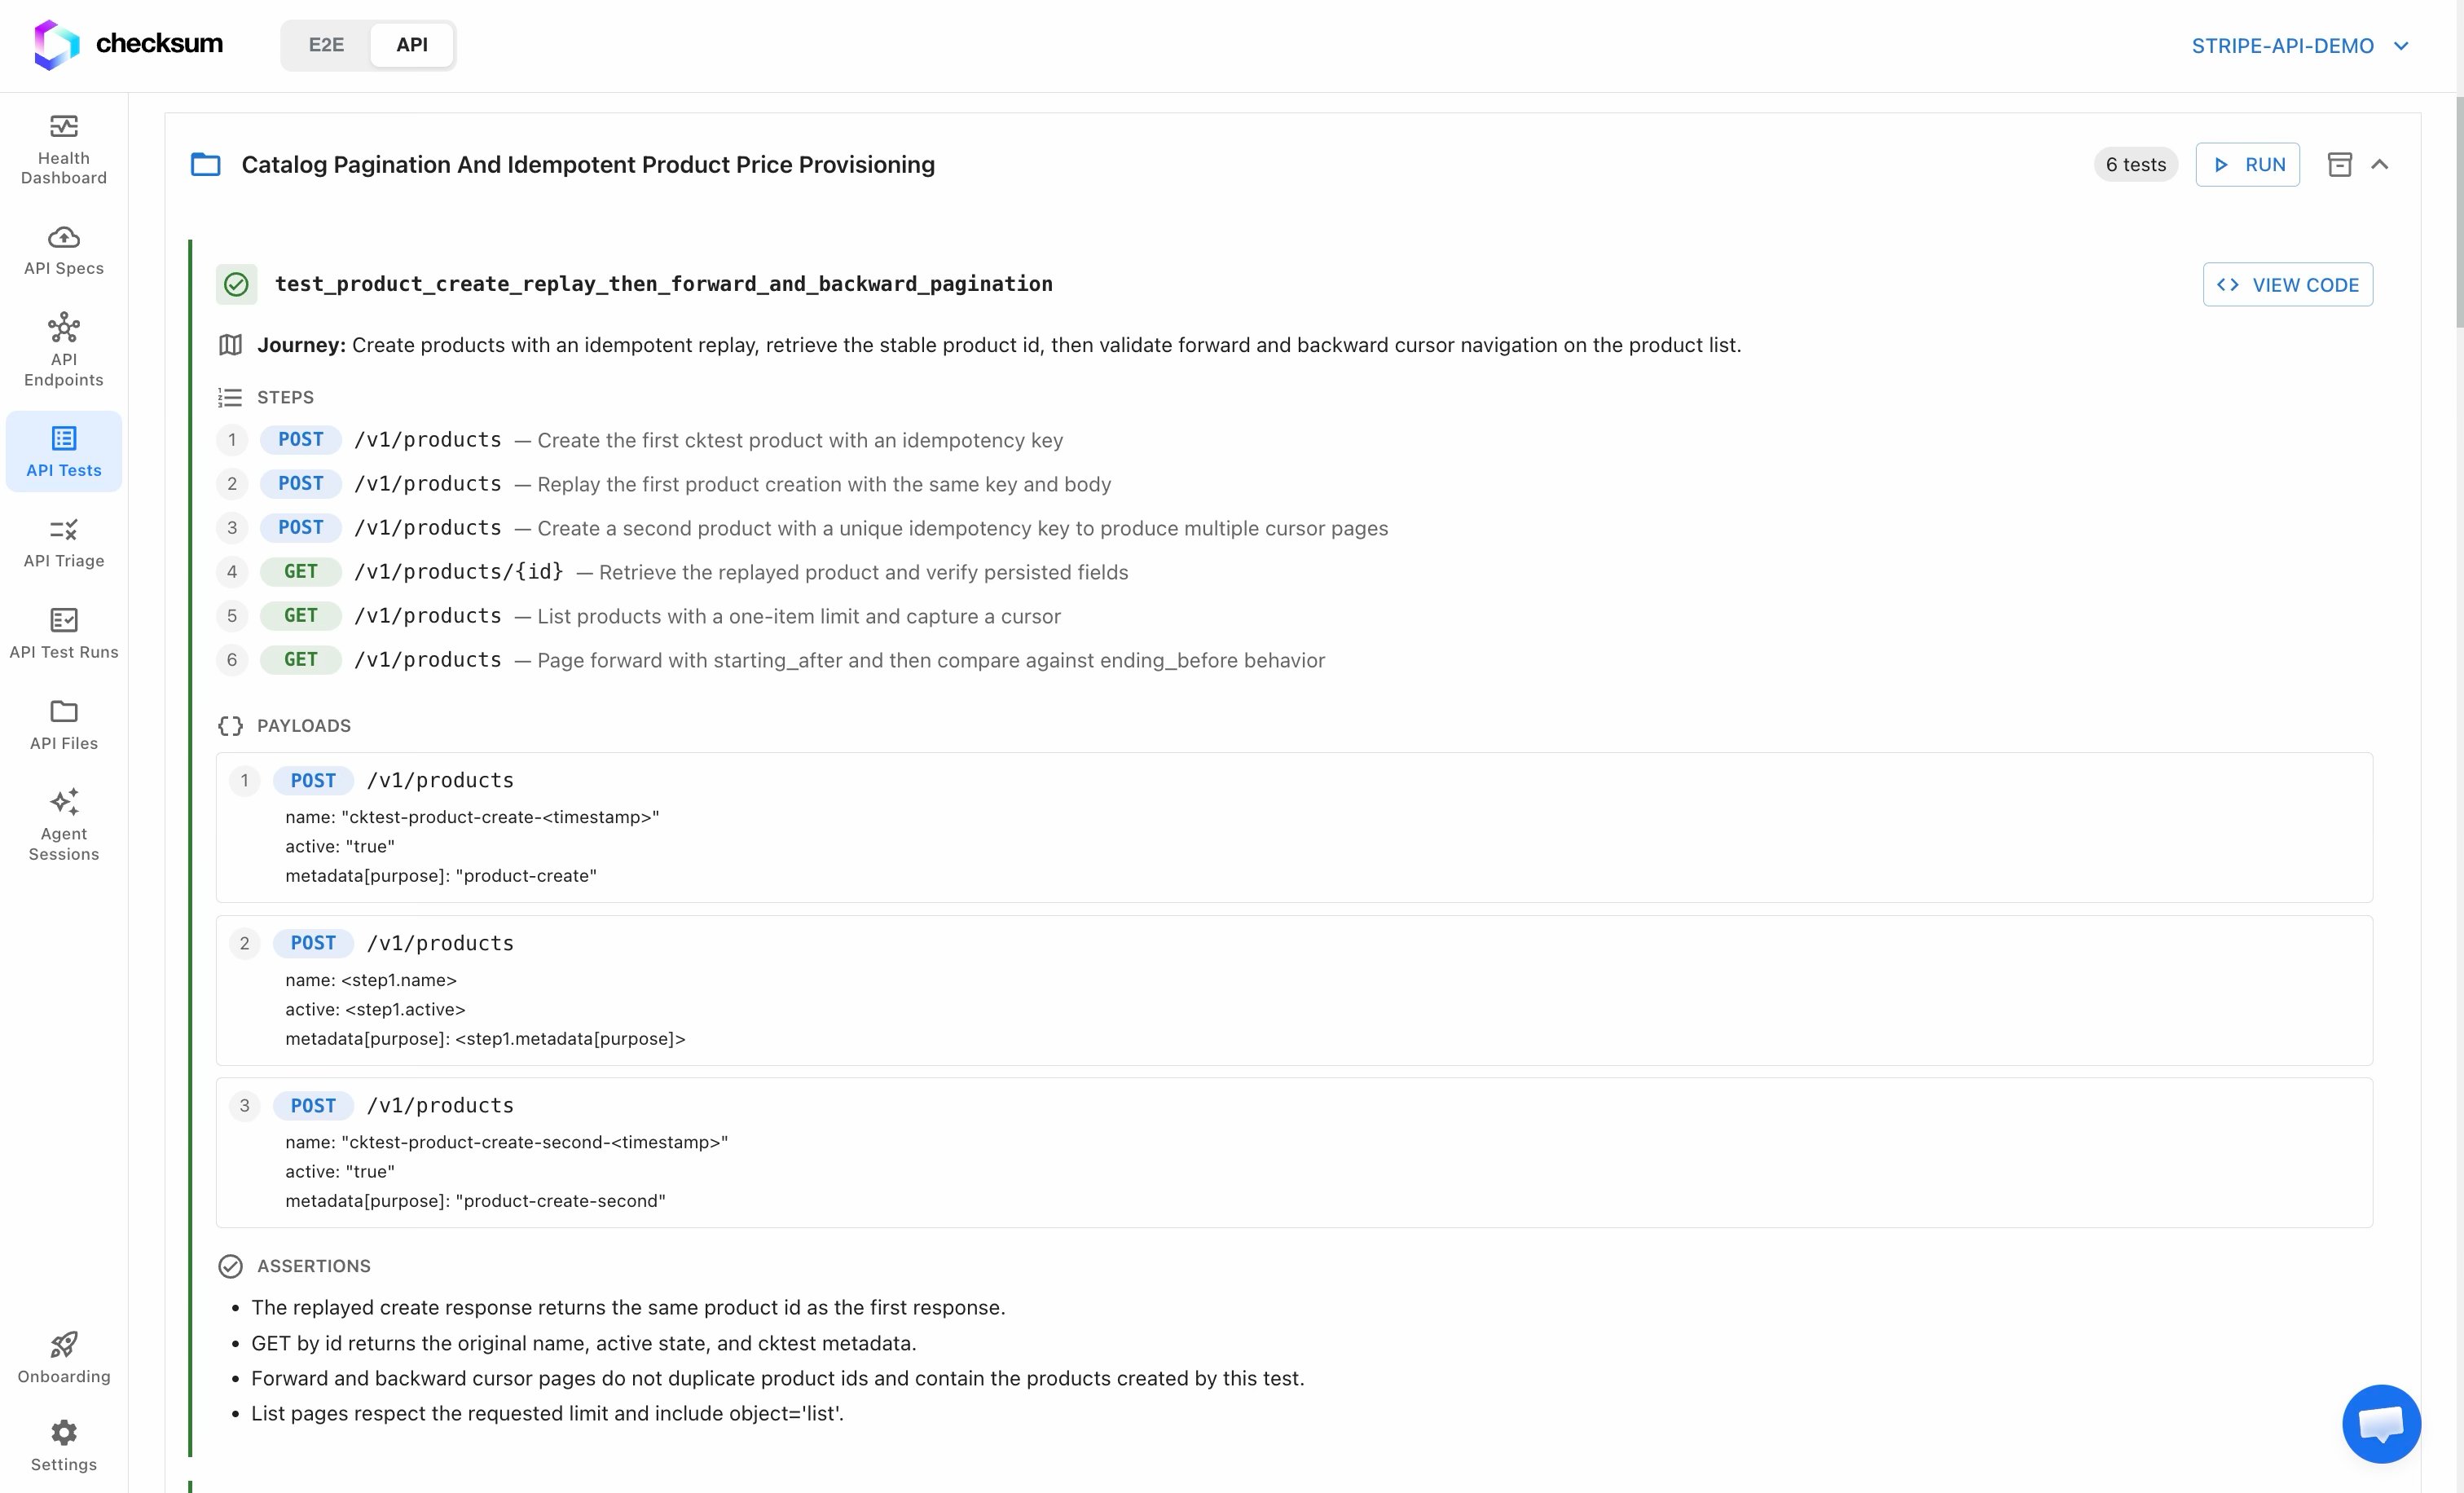
Click a suite to expand its test cases.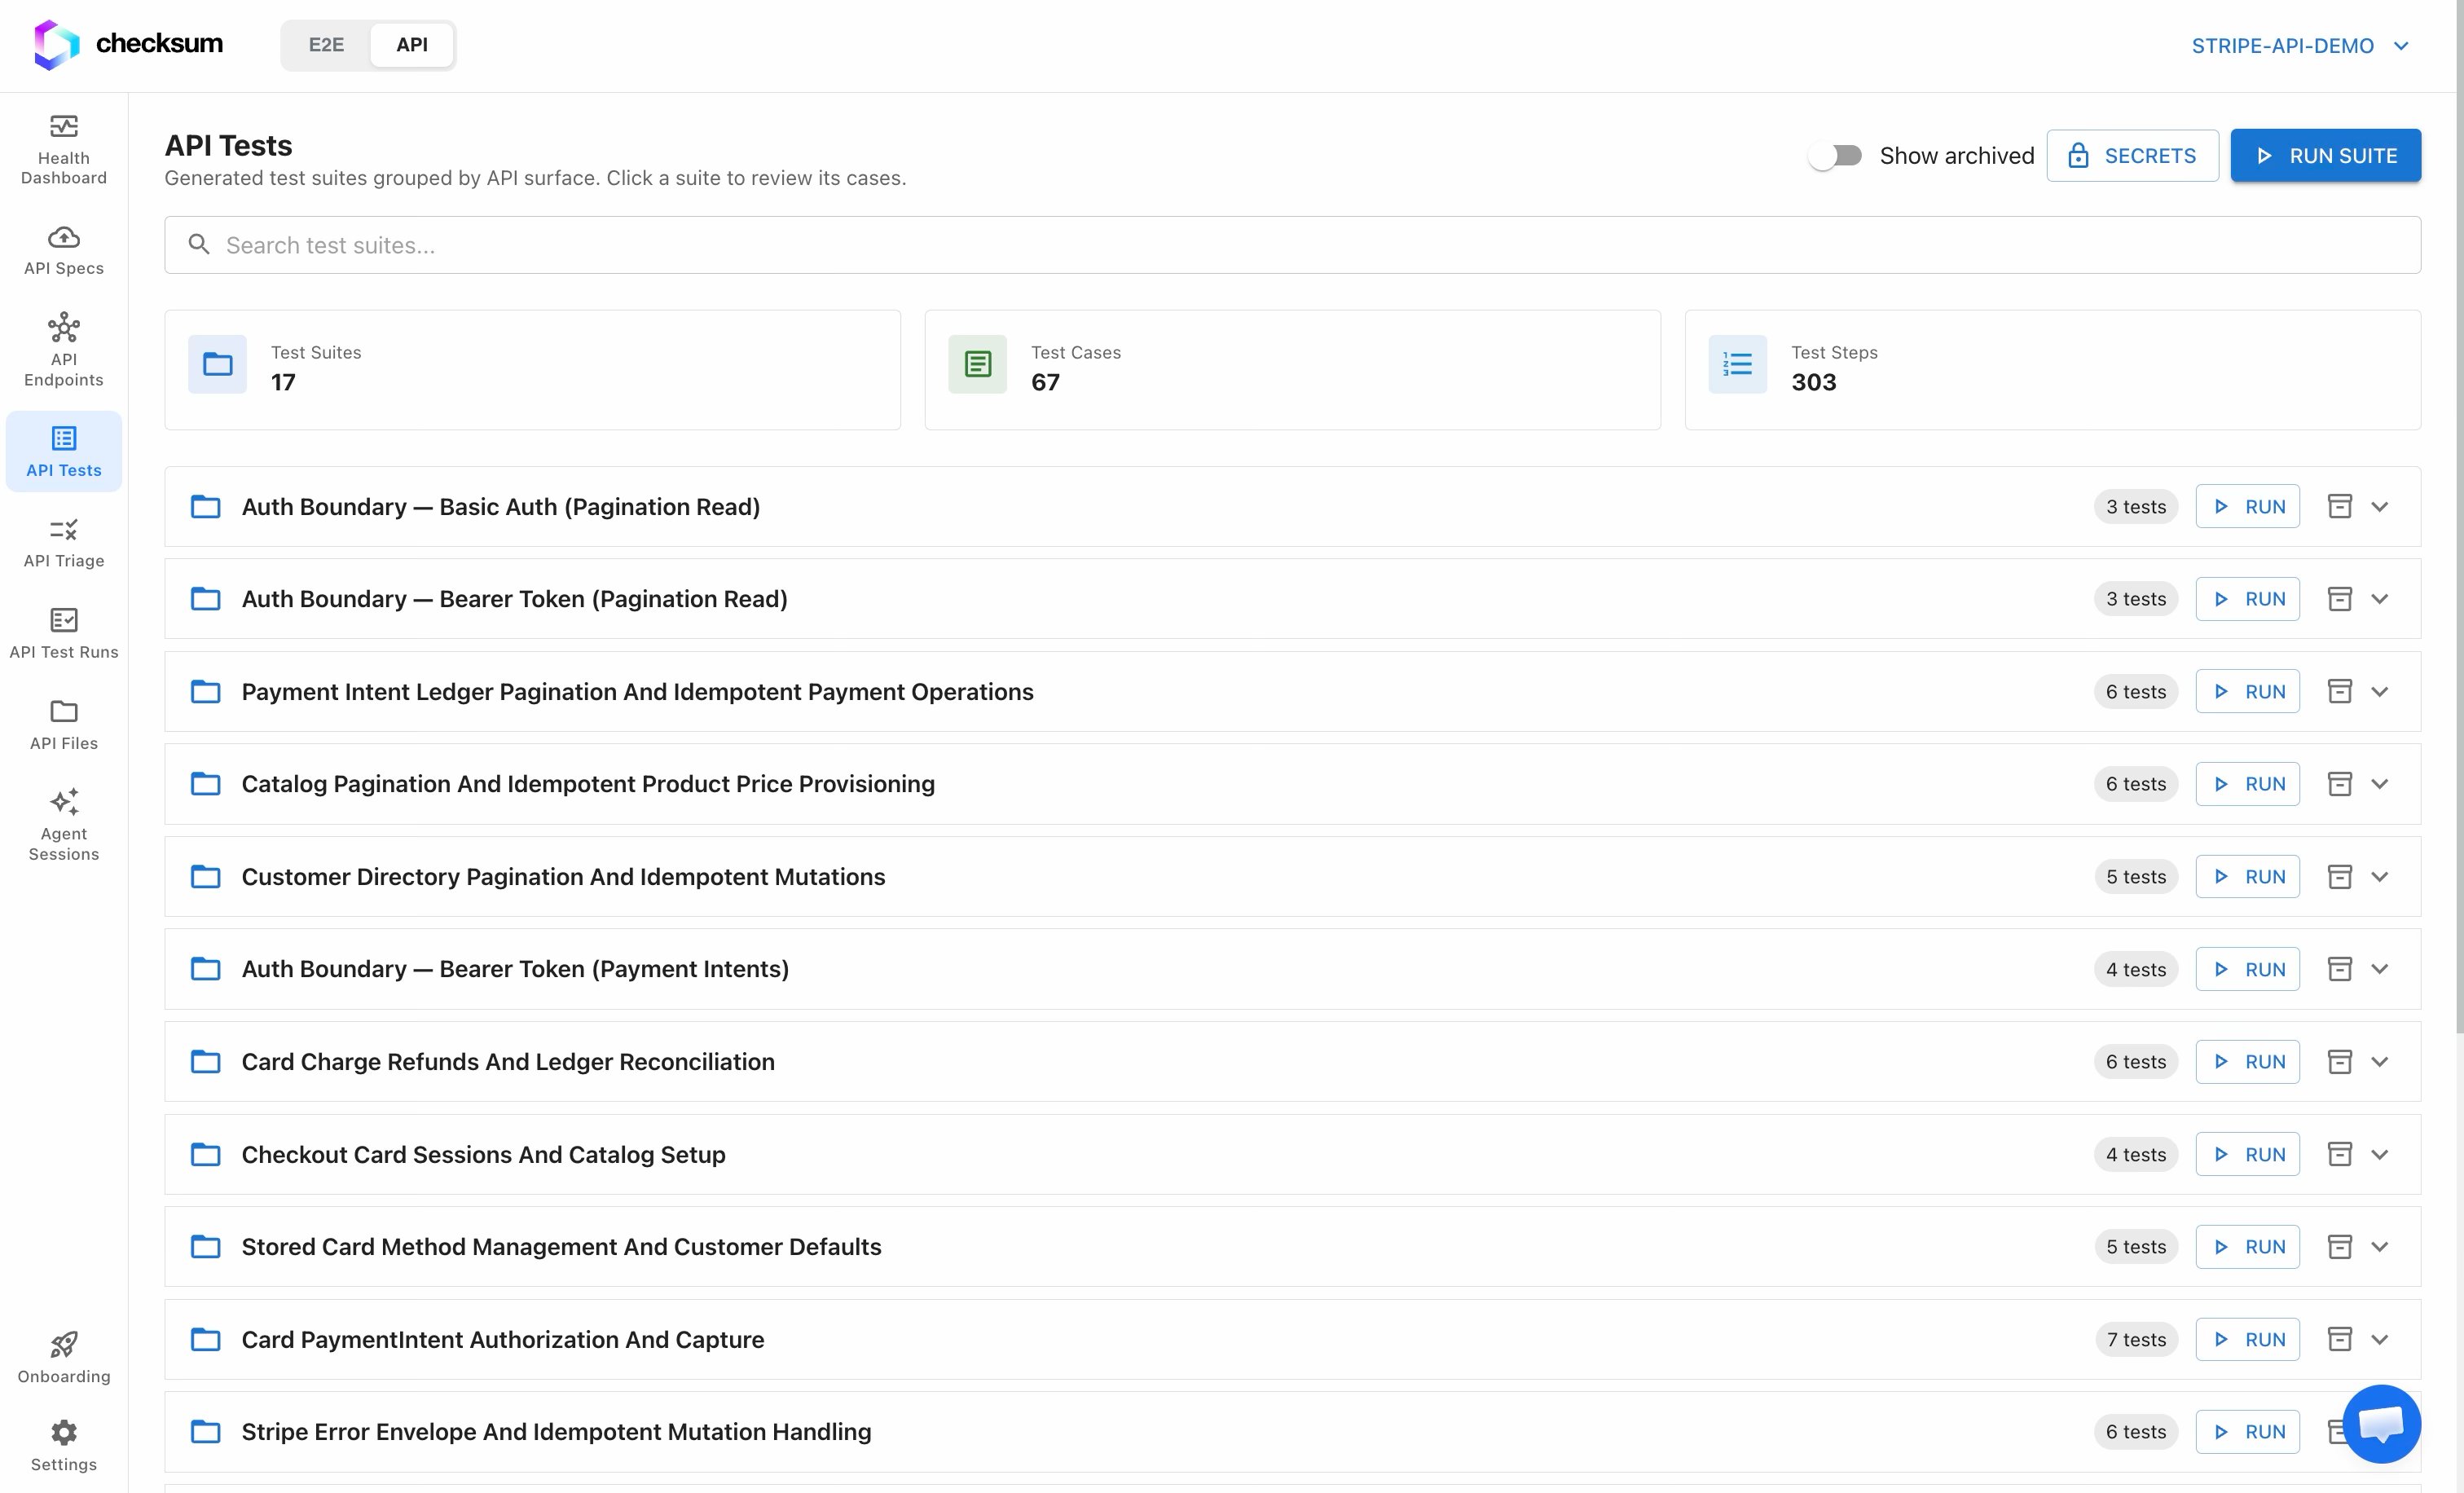
- Journey: a plain-language description of the end-to-end flow.
- Payloads: the request bodies the test sends.
- Assertions: what the test verifies.
- Steps: the individual API calls, in order. Each step shows its HTTP method, the path, and a short intent describing what the call does.
View the code
When you want the full detail, click View Code on a case to see the test source directly, with every assertion and call exactly as it runs.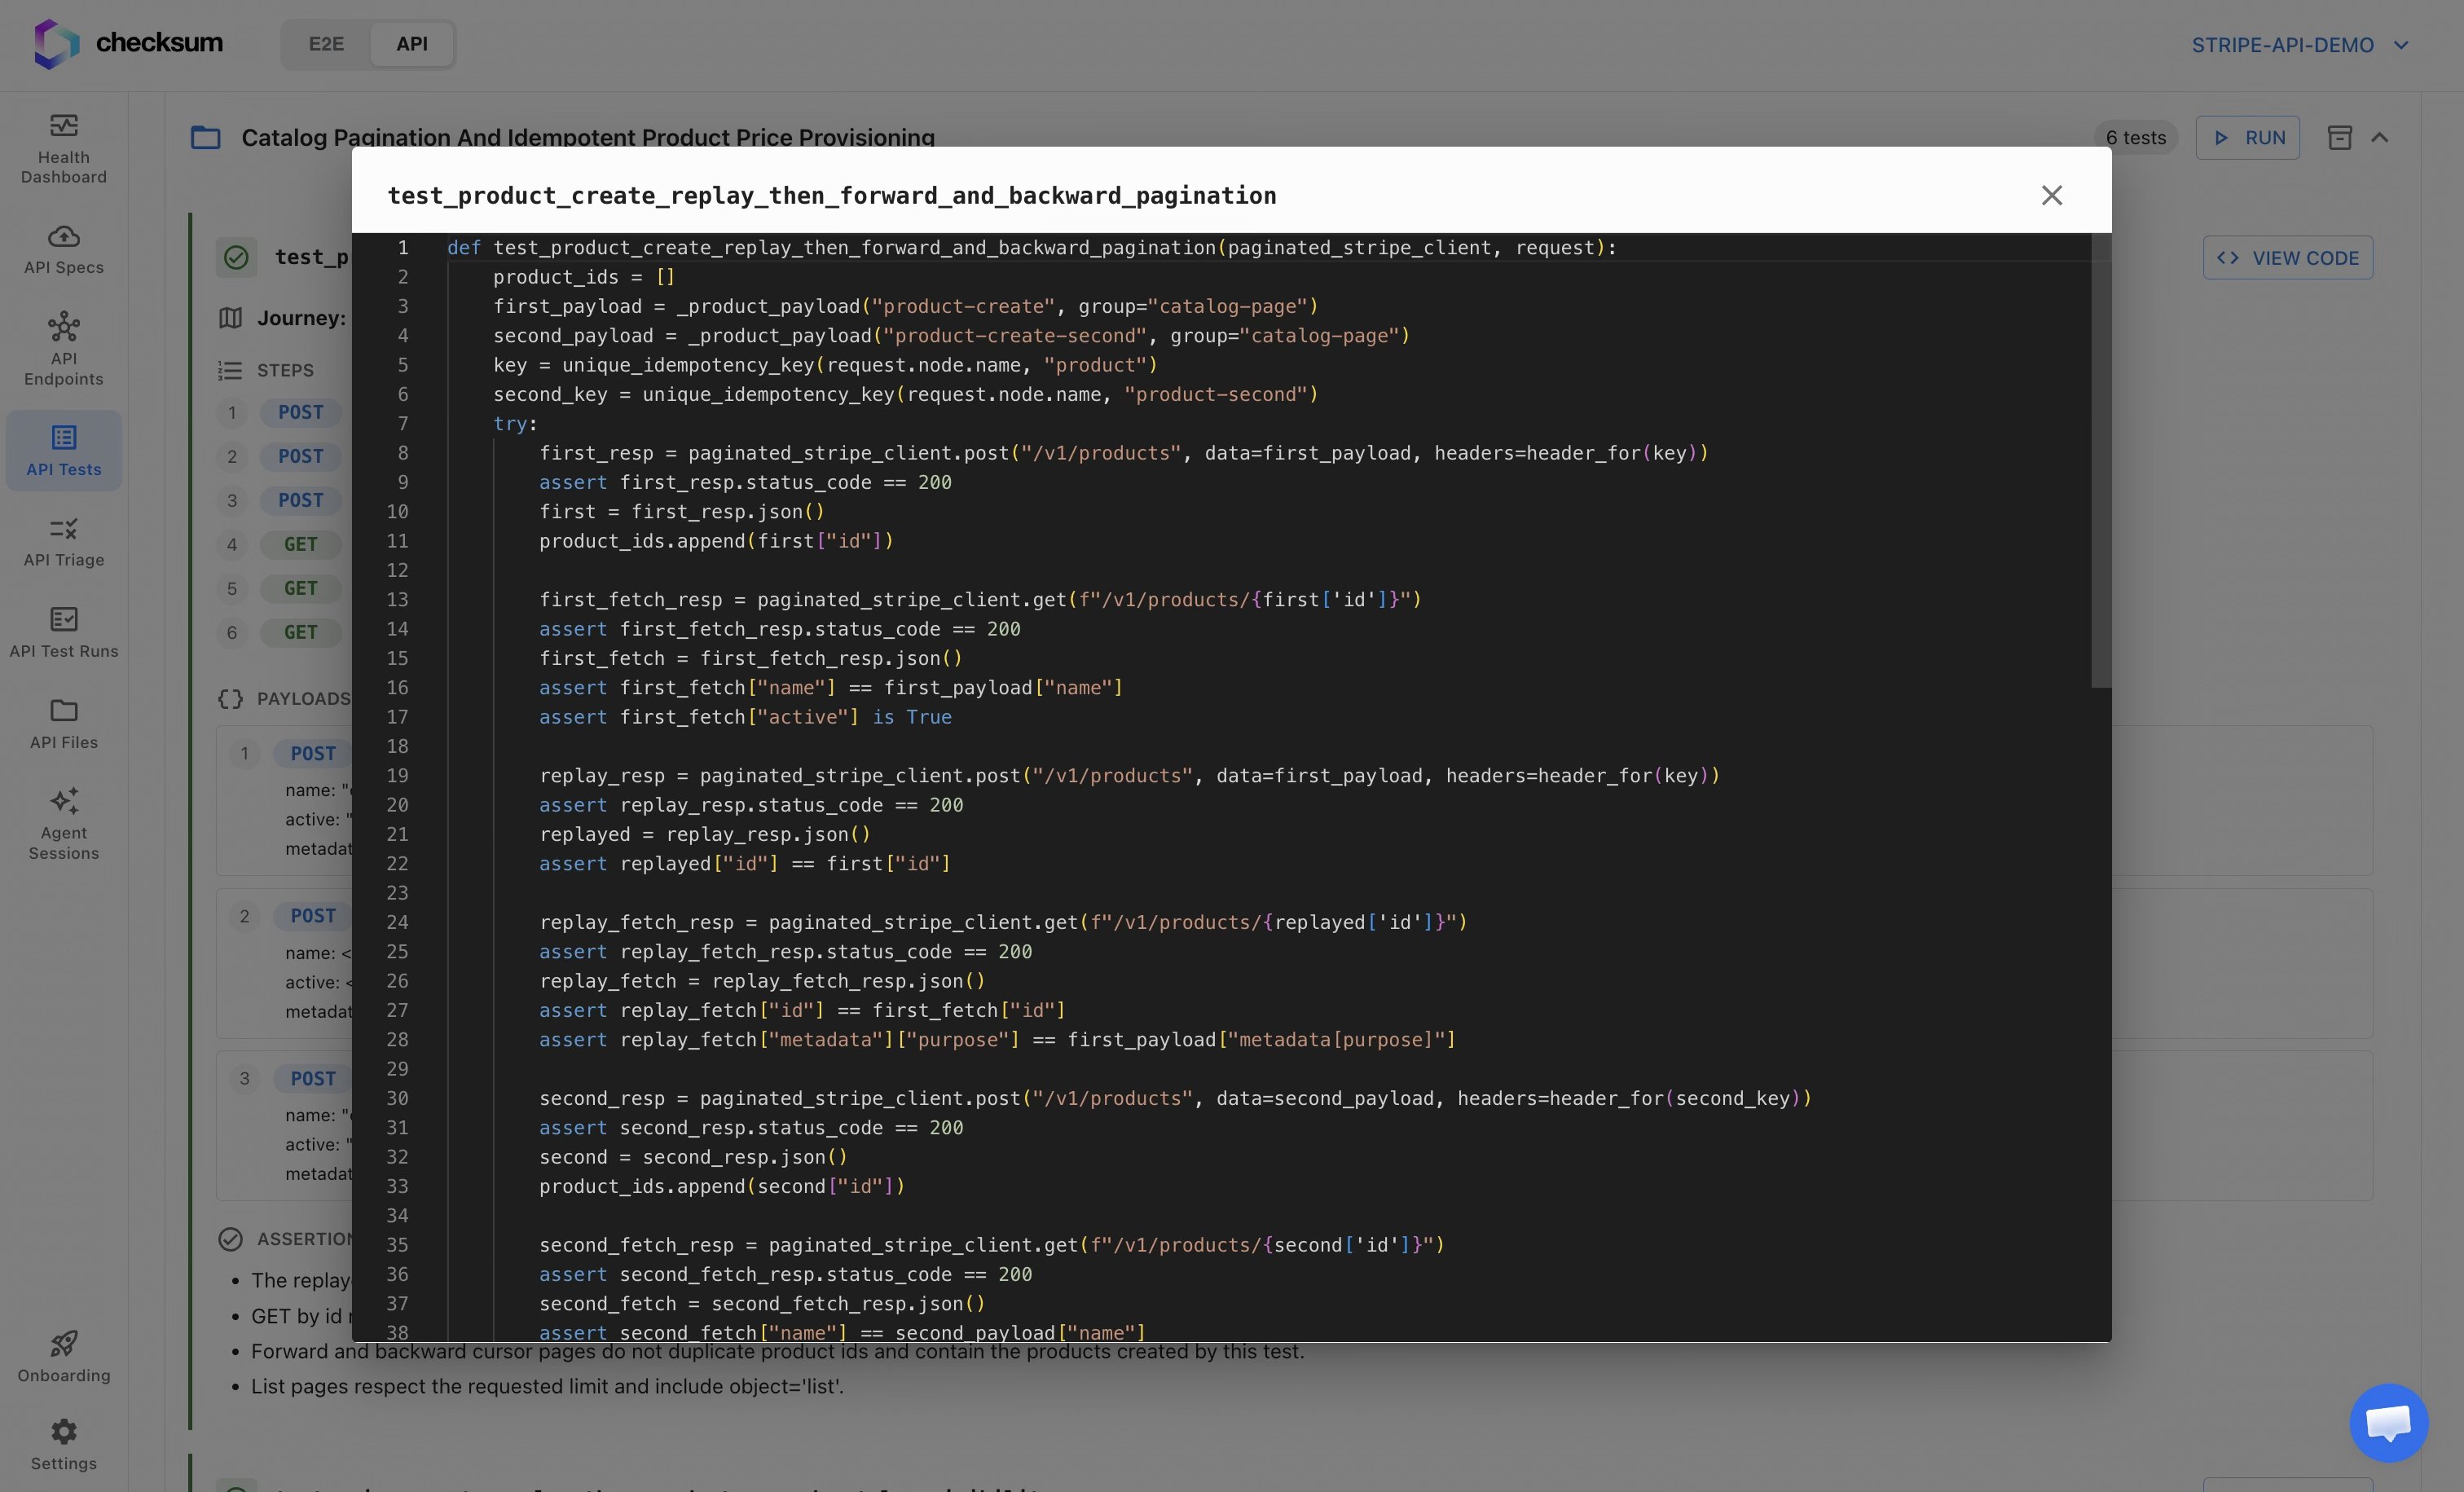
Potential tests
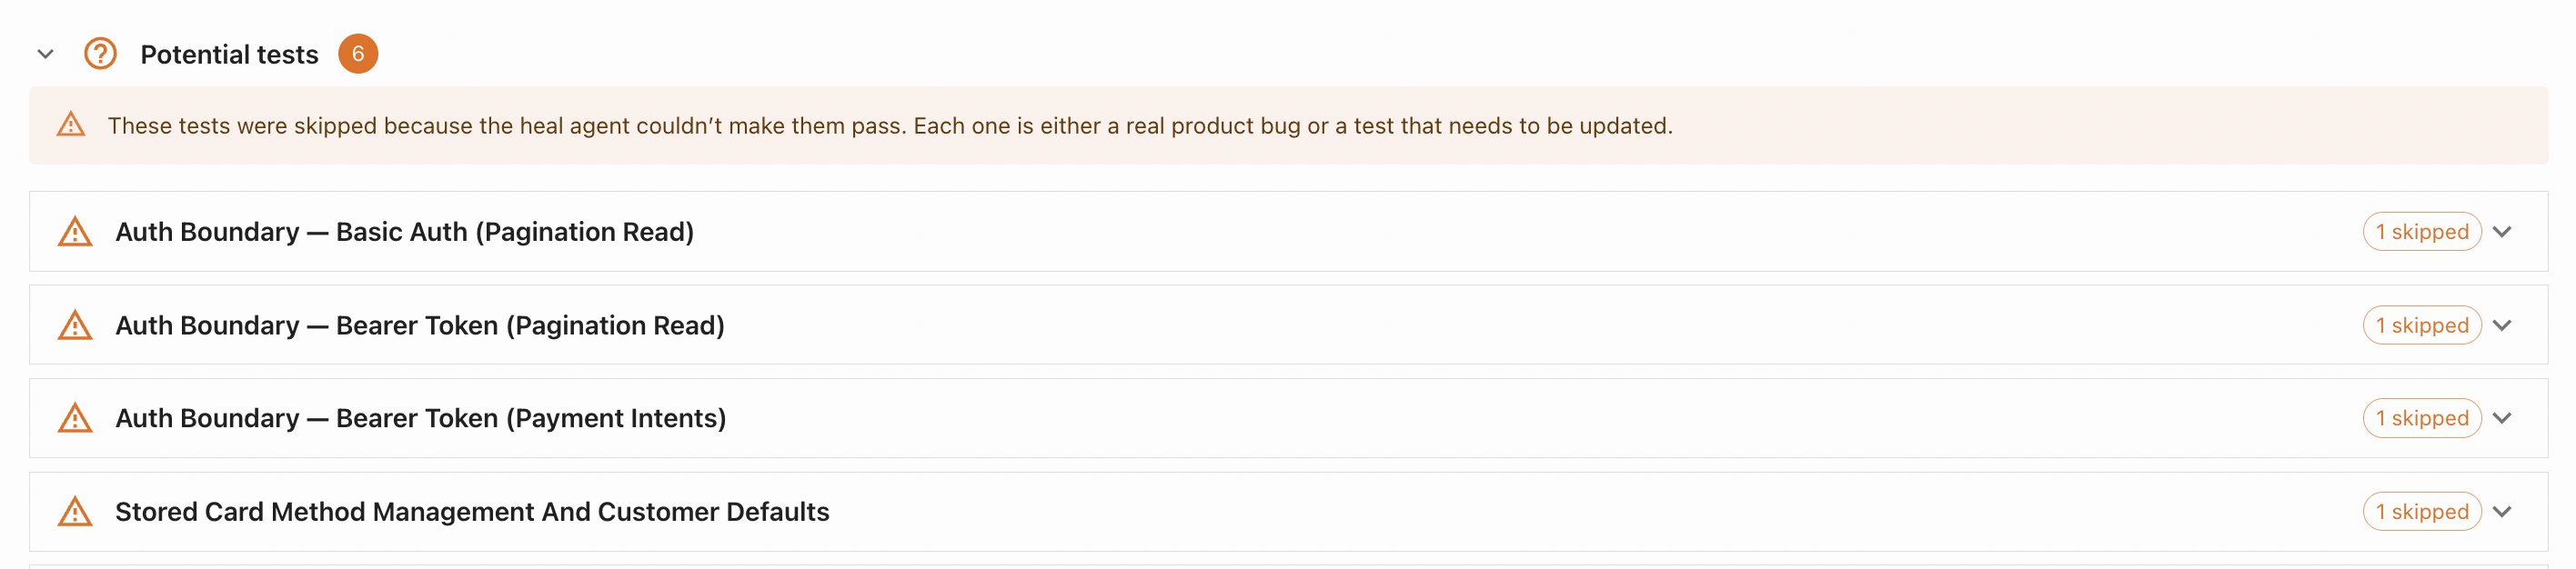
At the bottom of the page, the Potential tests section collects cases that were skipped: “these tests were skipped because the heal agent couldn’t make them pass. Each one is either a real product bug or a test that needs to be updated.” Expand it to see each skipped case with its reason, so nothing the agent attempted is lost. These same items also surface on the Triage board for you to resolve.